Architecture
Aetherion AirOps is a microservices estate on Azure Kubernetes Service, fronted by Azure API Management, backed by PostgreSQL and Redis, and observed through Application Insights, Log Analytics, managed Prometheus and Grafana. The Azure SRE Agent reasons across every tier, not just the cluster.
Environment at a glance
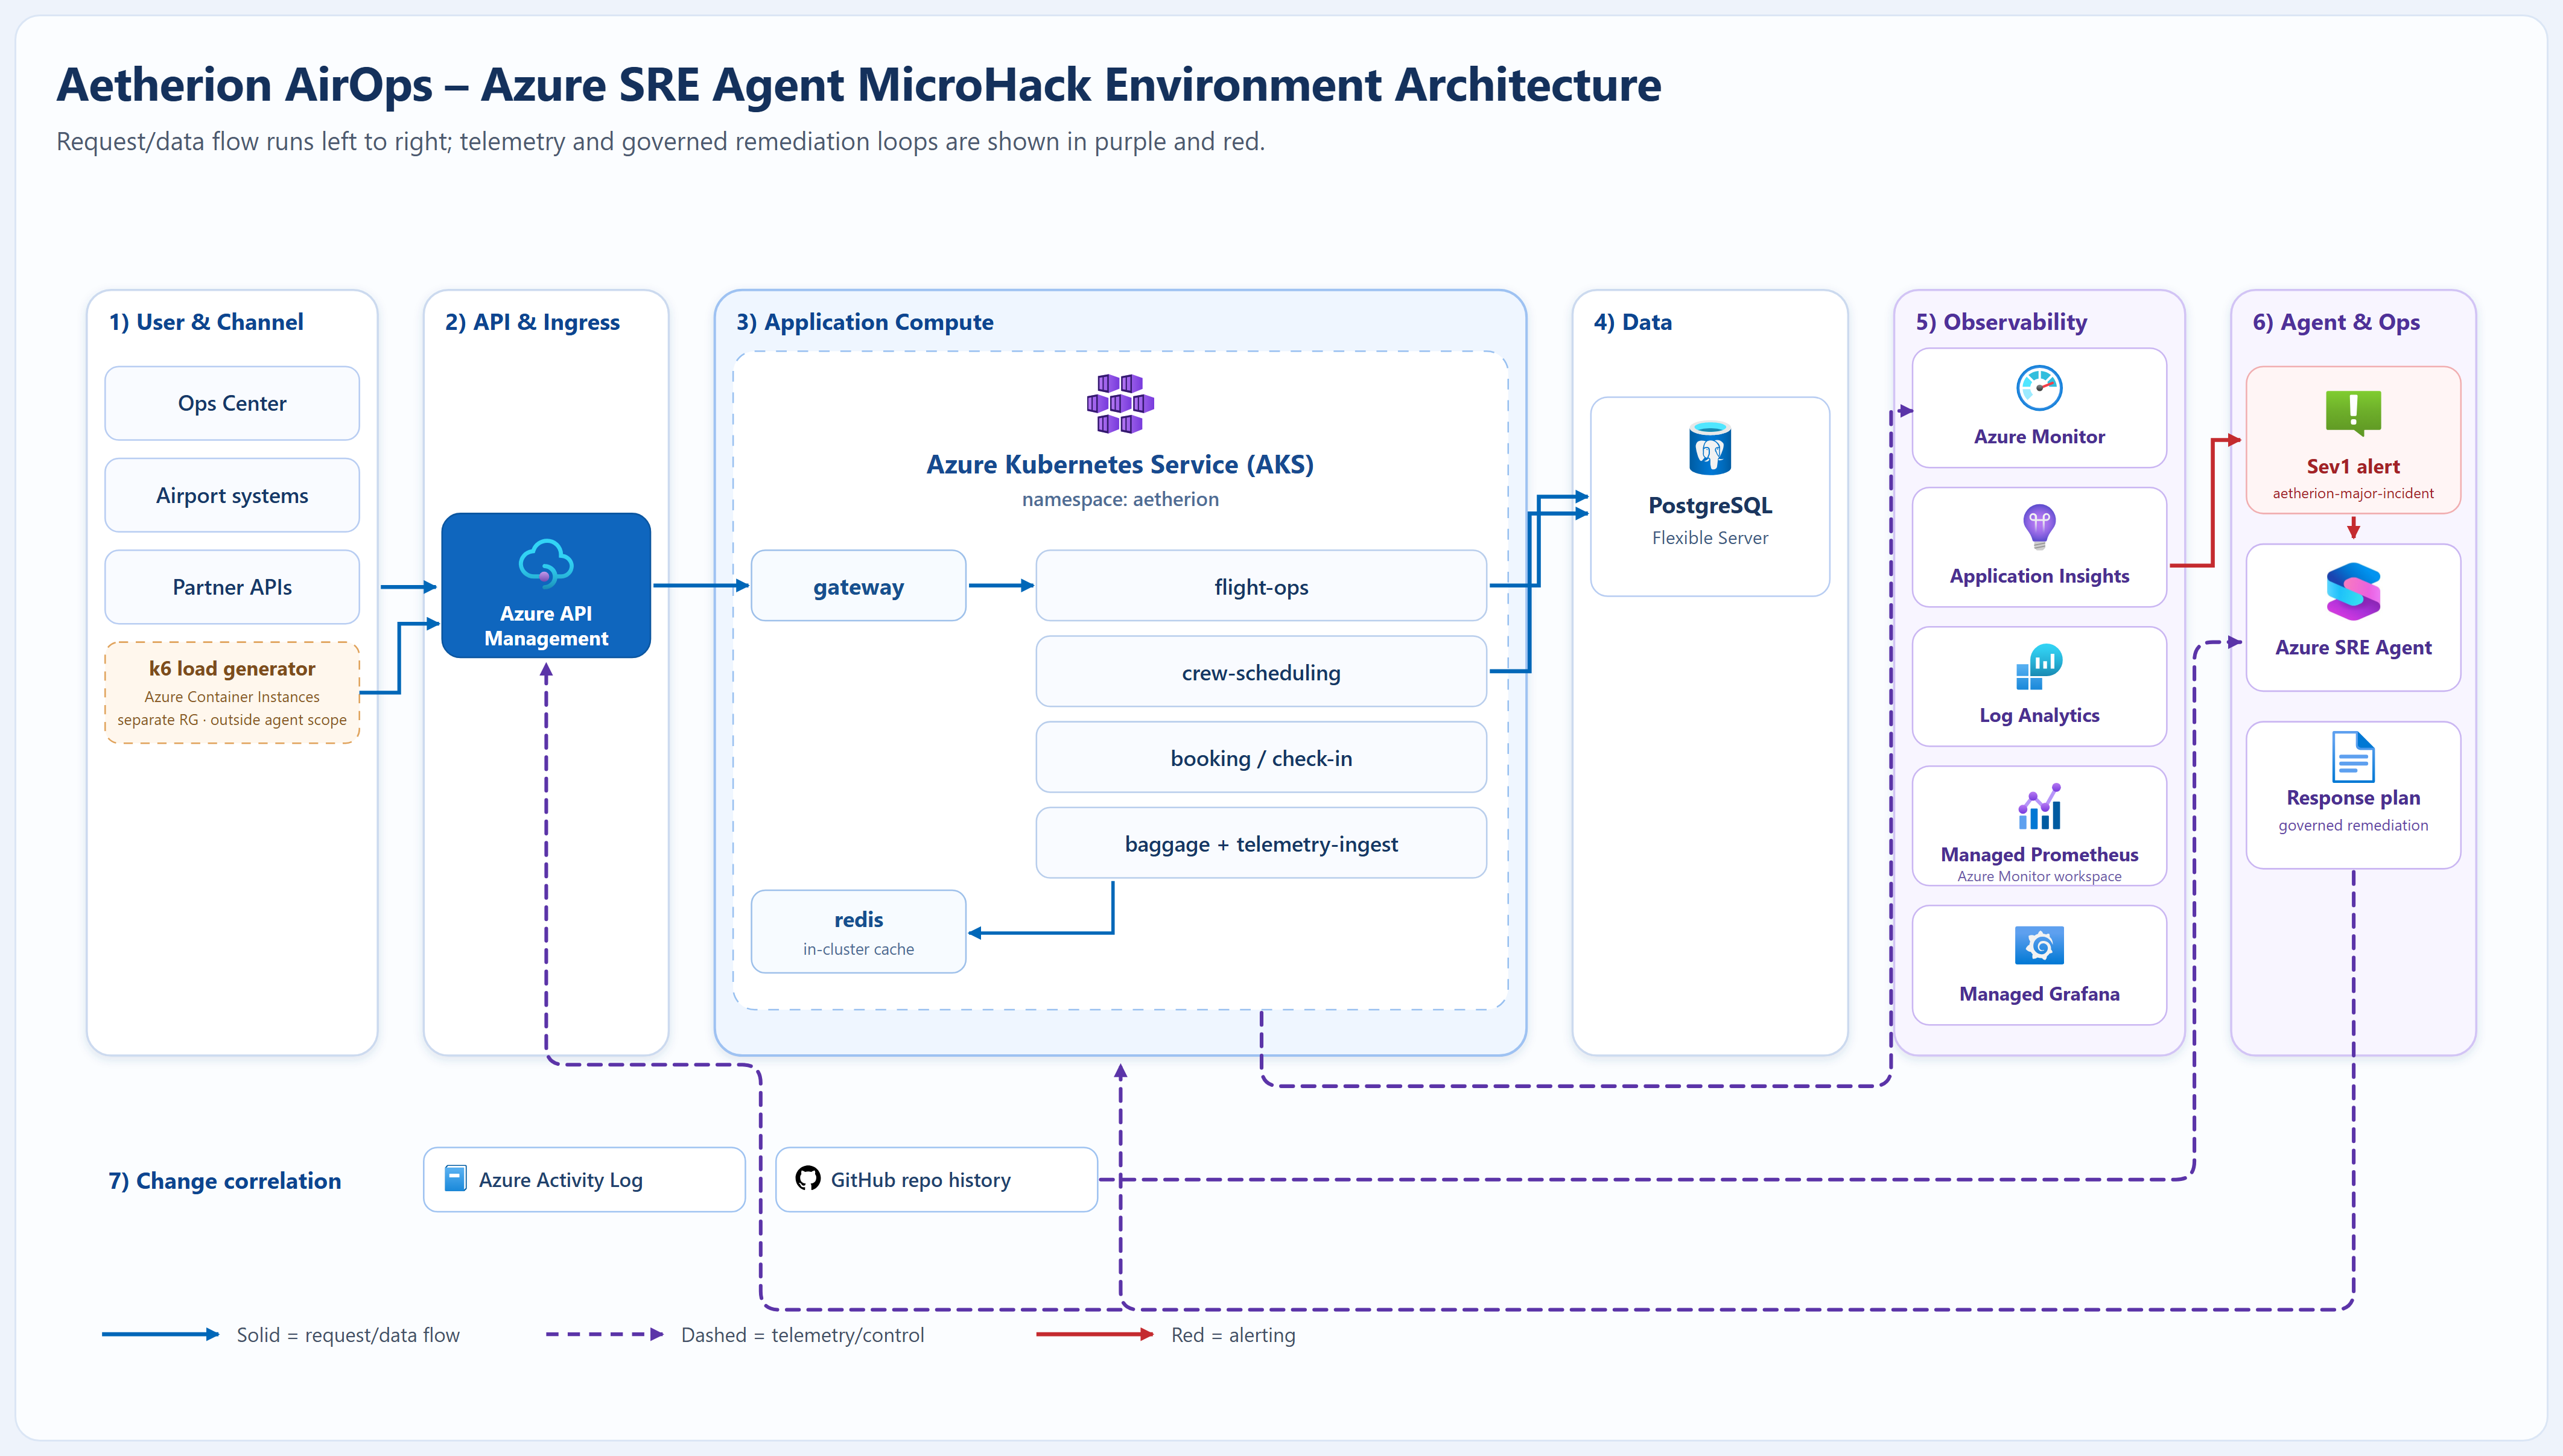
Request/data flow runs left to right (solid blue); telemetry and control flow to observability and the Azure SRE Agent (dashed purple); alerting is shown in red. Click the diagram to open it full size. The agent runs governed remediation back into APIM and AKS, correlating change via Azure Activity Log and GitHub history.
Executive view
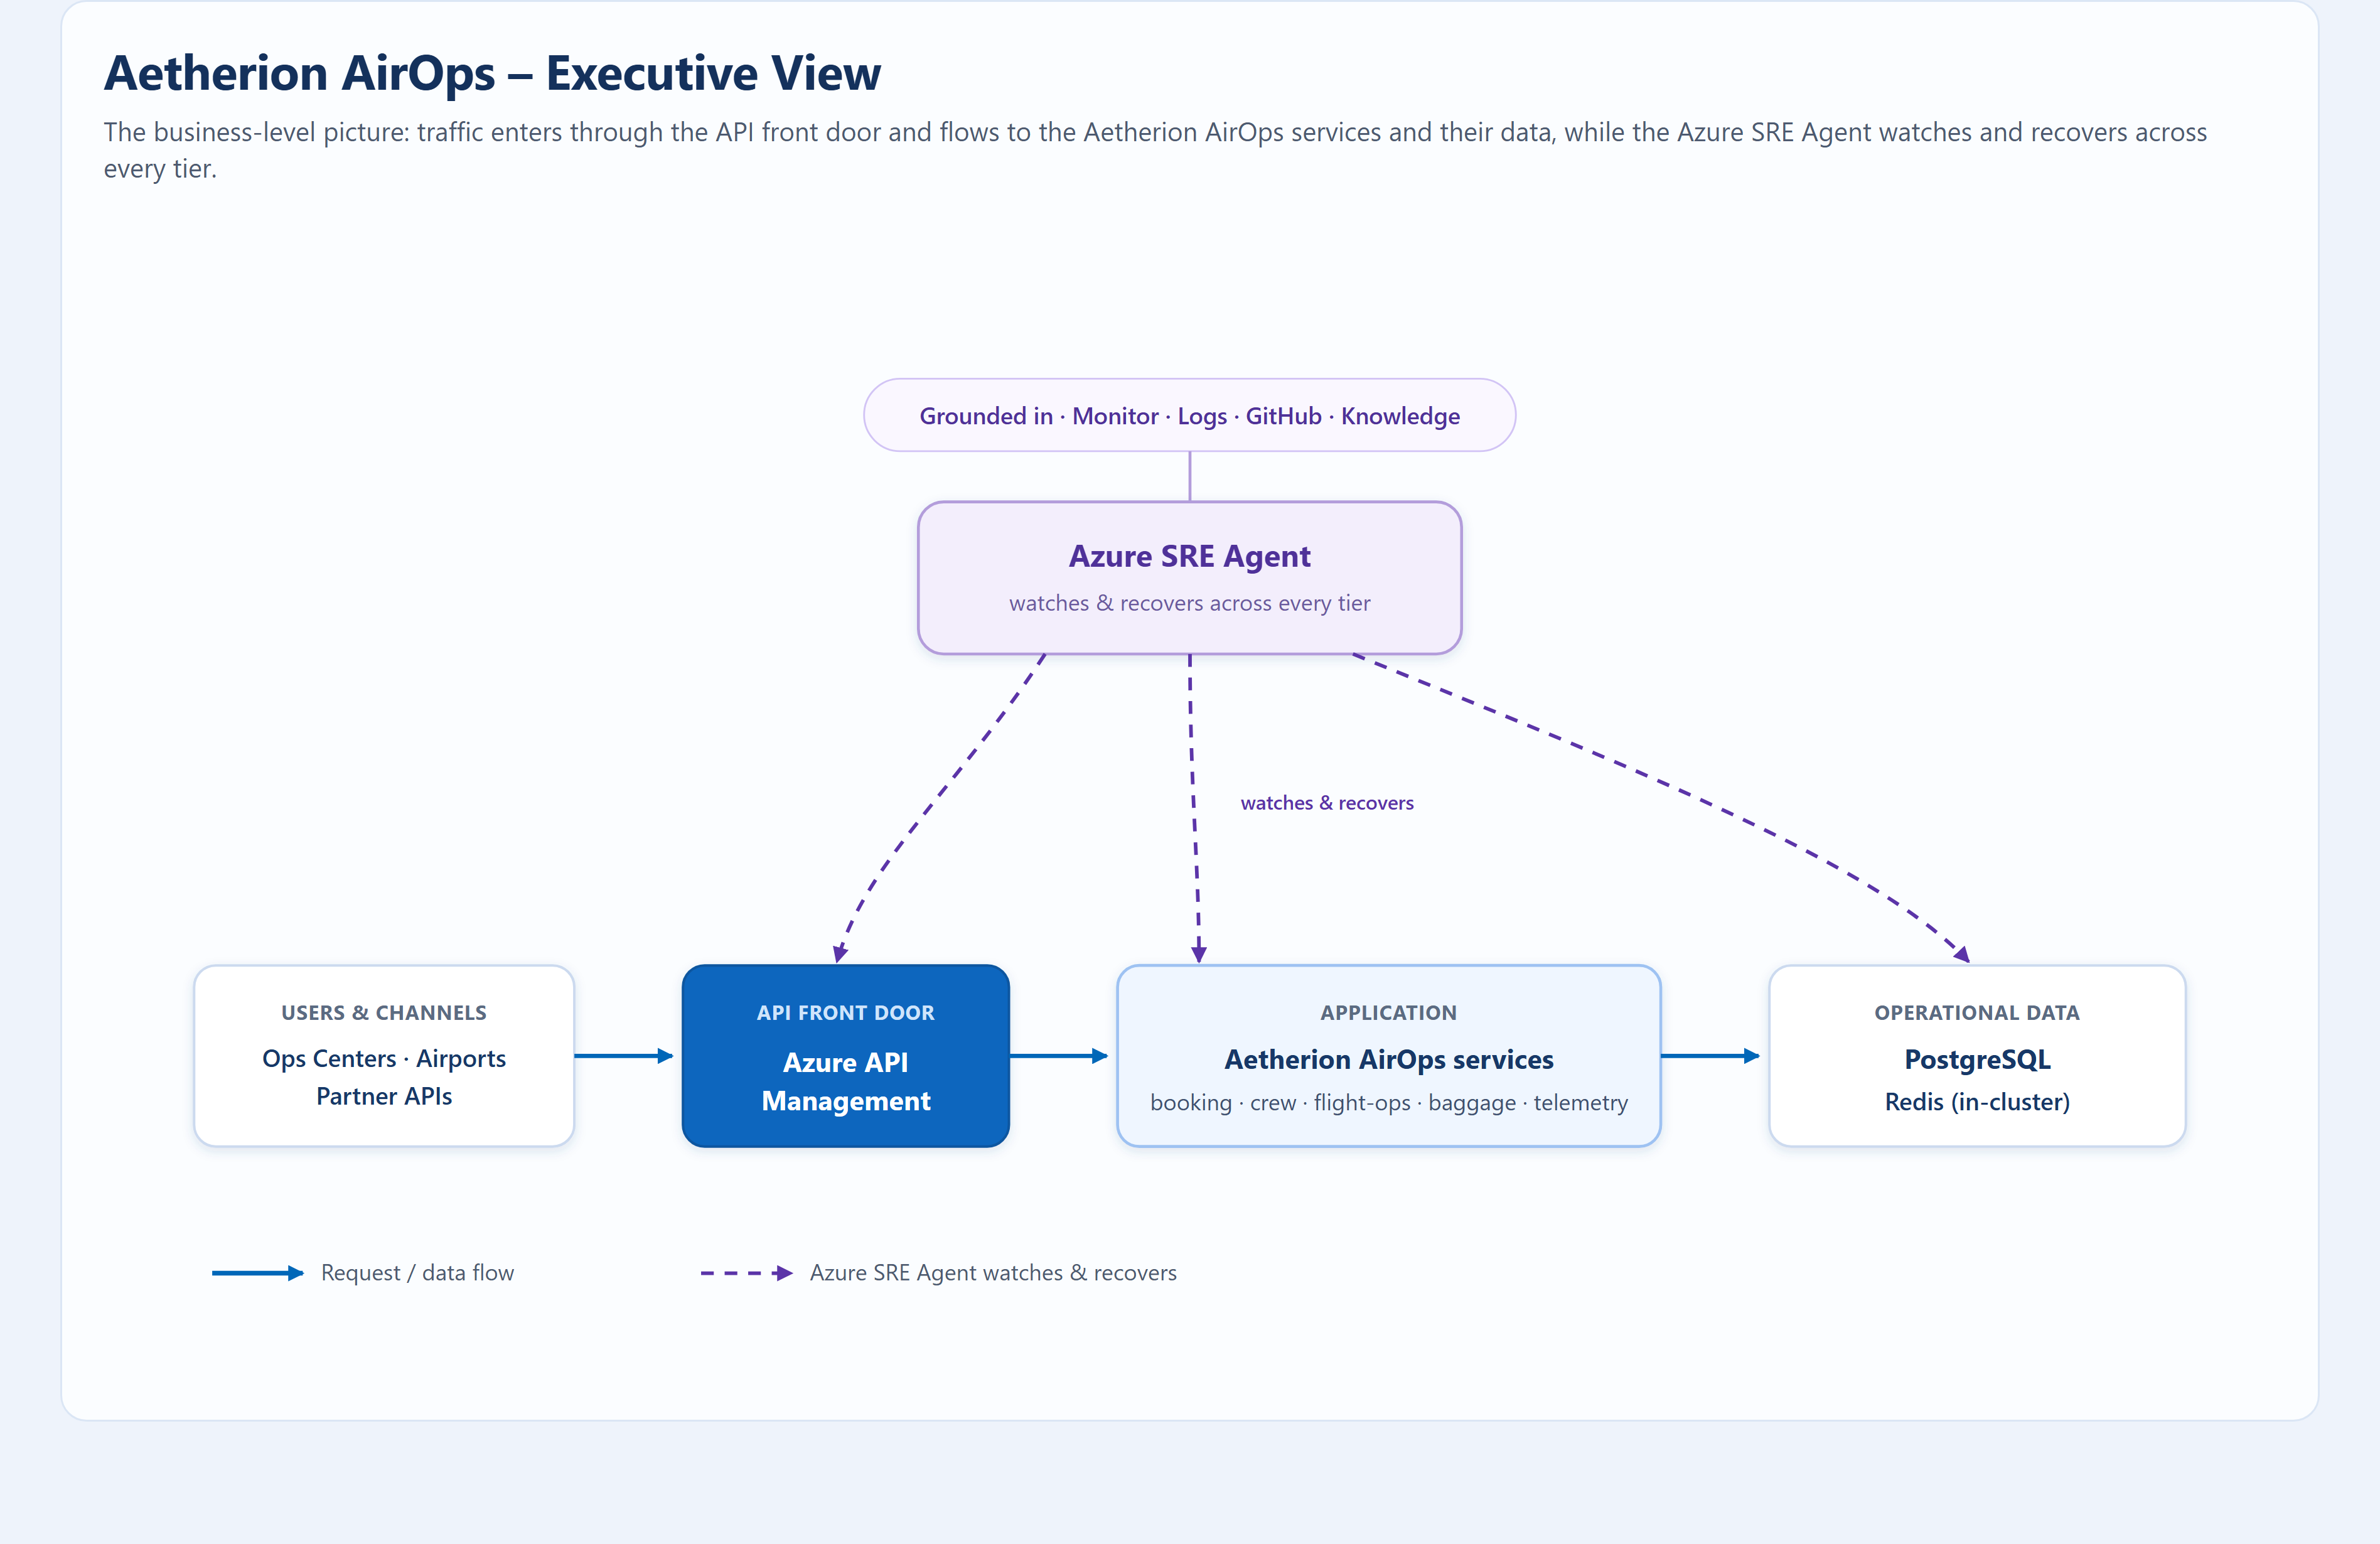
The business-level picture: traffic enters through the API front door, flows to the Aetherion AirOps services and their data, and the Azure SRE Agent watches and recovers across every tier, grounded in monitoring, source control and your runbooks. Click to open full size.**
Where faults hide
The symptom almost always appears at the edge (APIM 5xx or timeouts), but the root cause can live in any tier. The hack deliberately rotates incidents across the gateway, the cluster and the database so attendees learn to reason across the whole estate.
| Tier | Example fault | First signal |
|---|---|---|
| Edge (APIM) | A backend override published to the product policy | Gateway 5xx while services are healthy |
| Compute (AKS) | A release pinned to an image that can't be pulled | Pods never start, the tile goes dark |
| Compute (AKS) | A resource limit cut too far | CPU throttling, latency climbs under load |
| App rollout | A canary revision serving the wrong API surface | A slice of requests fails, the rest succeed |
| Data (PostgreSQL) | A query with no supporting index over a grown table | Database CPU saturated, pods idle and waiting |
Observability plane
- Operations Center GUI: live service health, operational-risk gauge, flight map, incidents and business impact. First place to confirm a symptom.
- Application Insights (
aetherion-appi): requests, dependencies, exceptions and the application map. - Log Analytics (
aetherion-law): container and node logs for deep-dive KQL. - Managed Prometheus (Azure Monitor workspace
aetherion-amw-*): pod and node CPU/memory time series scraped from AKS. This is what makes "is it CPU-bound or is it waiting?" answerable rather than a guess. - Azure Managed Grafana: metrics, traces and autoscaling correlation.
- Azure Activity Log + GitHub: change history for incident correlation.