Challenge 2 · Detect and Investigate Without Touching Production
Challenge 02 of 08 · Act II: Human-Guided Operations
Run mode: Review · Access: read-only investigation · Time: ~40 min
Stage: Foundation → Operations → Engineering → Autonomous → Major Incident
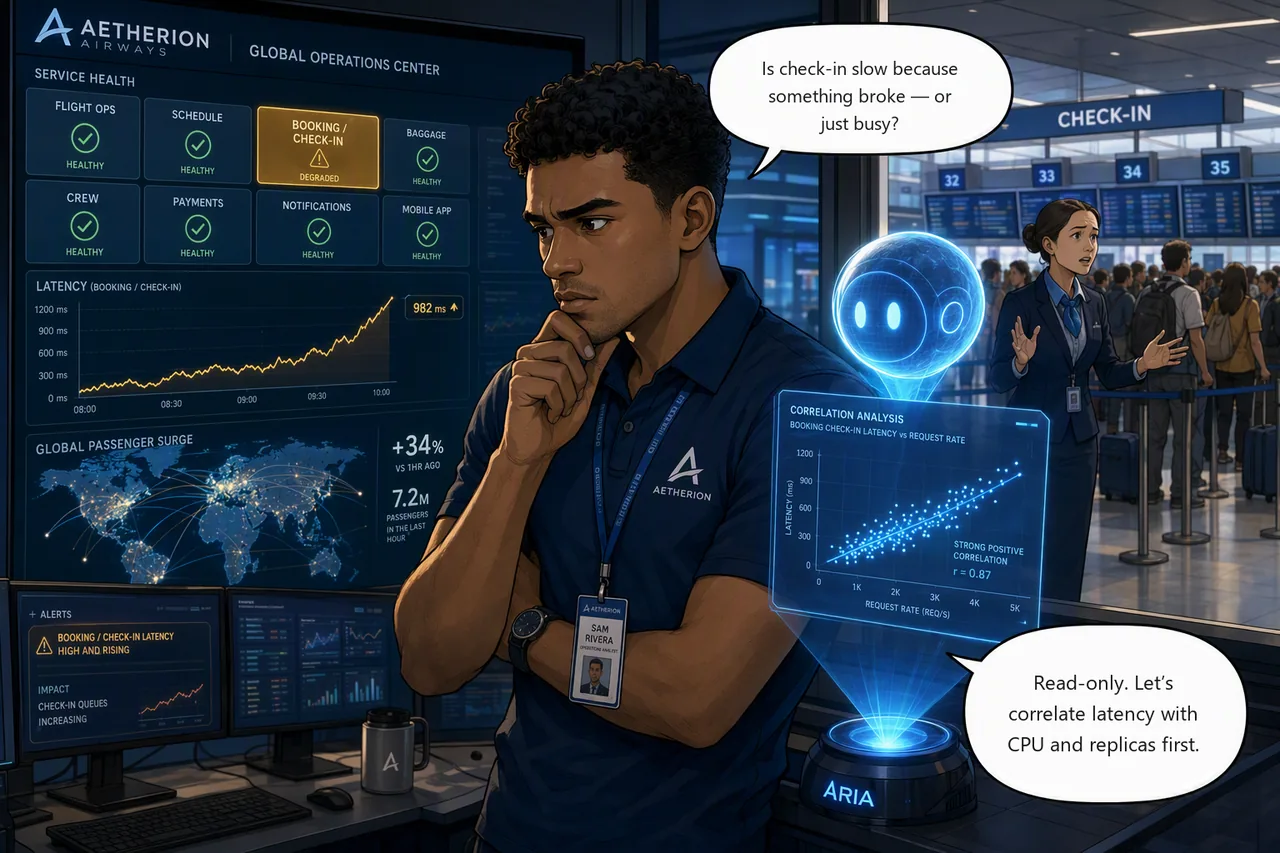
Situation: Online check-in has slowed to a crawl. Requests that used to be instant now take seconds, and the booking / check-in tile has gone amber just as traffic climbs toward a departure peak. Is check-in buckling under the surge, or did something change? This incident stays open into Challenge 3 — here you detect and investigate, you do not fix.
Mission: Confirm the check-in slowdown from live signals and form a hypothesis for the likely cause, backed by at least two independent signals, without changing anything in production.
Start this challenge
Starting Challenge 2 injects the first incident. Give it two or three minutes: check-in latency climbs from milliseconds to seconds and stays there, while the service keeps answering every request successfully, which is itself a clue.
Tasks
- Confirm the symptom. Compare check-in latency now to your Challenge 1 baseline, using the Operations Center and Grafana, and trust the measured delta.
- Correlate read-only. Have the agent line up
bookingrequest duration against CPU, replicas, dependency calls and request load. - Record your hypothesis. Capture the likely cause, the two signals behind it, and the recovery you'd propose (without performing it).
Suggested Azure SRE Agent prompt
Paste into the agent chat
Check-in has slowed to a crawl. Investigate read-only and tell me the most likely cause, with the evidence behind it. Change nothing.
That is deliberately thin, because it is what you would actually type at 18:12. The agent's first answer will be broader than you need. Push back on it, and notice which follow-up finally moves it forward: that is the skill this challenge is really teaching.
Optional: feed the agent a HAR trace or screenshot
If a partner reports the failure from their side, capture a HAR (HTTP Archive) trace (browser DevTools → Network → Save all as HAR) or a screenshot of the failing call and upload it in the agent chat. The agent parses HAR and image files directly and folds client-side timing into its investigation.
Success criteria
- You've confirmed the slowdown and can name the affected service and user-facing path.
- You can name the most likely cause, backed by at least two independent signals, and separate the surge from the change that caused it.
- You've made no change to production.
Verify your work
Run this when you're done. It grades the real end state:
Hints
Confirm and correlate. Start from the delta against your baseline. Line up request duration with CPU, replicas and request load over the same window.
Capacity, or something else? A service starved of CPU is busy. This one
isn't. CPU is low, no pod has restarted, and every request still succeeds. It is
waiting on something. Work out what booking talks to besides its database,
and how long each of those calls is taking. Then compare the live workload against
what the repository's manifest declares; the gap between them is the finding.
You're done when you can describe the symptom precisely and defend a hypothesis, not when it's fixed.
How an experienced operator would have scoped it. Still going in circles? This is the prompt someone who has worked this failure class before would write:
Analyze the check-in / booking path read-only. Correlate
bookingrequest duration with CPU, replica count, dependency call durations and request load over the last 30 minutes, and check recent deployments and rollout history for changes in the same window. Compare the live workload against what the repository's manifest declares. Give me the most likely cause with supporting evidence, and change nothing.
Read it before you paste it. Every clause is a decision: which window, which signals, and the one that does most of the work here, comparing what is running against what the repository declares.
Stuck? Step-by-step for each task
Give each task a genuine attempt first and skim the hints above. When you want the exact clicks, open the matching task below.
Task 1 · Confirm the symptom
- Open the Operations Center and note the booking / check-in tile: its p95, its error rate, and how steady the numbers are. Then open the Grafana dashboard for the same window. The two together are your evidence, not the agent's summary.
- Compare that to the baseline you captured in Challenge 1. Requests that took single-digit milliseconds now take seconds, and they all still succeed. A clean, flat, elevated latency is rarely load.
Task 2 · Correlate read-only
- In the agent chat, paste the suggested prompt above (or ask it to
correlate
bookingrequest duration with CPU, replica count, dependency call durations and request load over the last 30 minutes). - Watch for the disagreement between signals: latency up sharply while CPU, replicas and error rate are all normal. Something is being waited on, not overloaded.
- Ask it to compare the running workload with the manifest in the connected repository. A live value that no longer matches the checked-in one is the strongest single piece of evidence you will find.
- Stay read-only, you're gathering evidence, changing nothing.
Task 3 · Record your hypothesis
Paste this into the agent chat:
Summarise this investigation in under 200 words: the likely root cause, the two independent signals that support it, and the least-disruptive recovery you would propose. Do not perform any remediation.
Then save it so Challenge 3 can pick it up. Either leave it in this chat
thread, or commit it to memory by typing /remember . in the chat box
(it becomes #remember), or by saying "save this to your knowledge".
Confirm it stuck. In a new chat thread, ask:
What do you remember about the check-in slowdown?
If it repeats your hypothesis back, it saved. If it doesn't, the summary only exists in the old thread, so keep that thread open for Challenge 3.
Write down one number before you move on
Note the wall-clock time from when you ran start-challenge.ps1 2 to
the moment you could defend a hypothesis. Just the number of minutes,
on paper or in the thread.
You are investigating this failure class cold, with an agent that knows nothing about Aetherion yet. In Challenge 7 you meet the same class again, by which point the agent has your runbooks, a specialist subagent and a memory of today. Challenge 8 asks you what that was worth, and this is the only chance to capture the before number.
Reference
Up next: Controlled recovery under approval
With a defensible hypothesis, you're ready to recover check-in under approval and then the flight board goes dark.